|
11/15/2000 -- Speaking from an MCSE consultant's perspective, a paradox of being a Windows 2000 consultant is how to make a great living after the install is completed? Many MCSE consultants discover with Windows 2000 that their billable hours are behind them after the design, planning and implementation of the network. In fact, a frustration that causes some consultants to leave the business altogether is the project-by-project workflow of Windows 2000 consulting, with consultants going from one implementation to another. It's no way to make a steady living.
Enter System Monitor to the rescue. If you're an MCSE consultant, you can use System Monitor to provide services to clients long after implementation, which can add real value to the consulting relationship. (Although I focus on independent consultants in this column, in-house IT professionals should find the tips below to be of value.) Defining System Monitor
Perhaps the first thing you noticed about System Monitor is that it's free. System Monitor is installed as part of the Windows 2000 Server or Windows 2000 Professional basic setup. It certainly wasn't lost on me that, compared to my NetWare days when I used PERFORMANCE.NLM, the System Monitor in Windows 2000 is much more powerful. And it wasn't lost on me that I didn't have to spend several hundred dollars purchasing a third-party performance monitoring application.
System Monitor has five distinct interfaces that it presents to you: charts, histograms, alerts, logs and reports. Each of these faces is accessible from a toolbar button in System Monitor. You typically right-click in the details pane (the big space to the left) and select New to configure one of the five faces. These keystrokes are consistent with the way you configure other Microsoft Management Console (MMC) snap-ins, so I'll only show you the keystrokes for creating a chart. (I'll present the four steps for using System Monitor as an MCSE consultant later in this article.) Charts
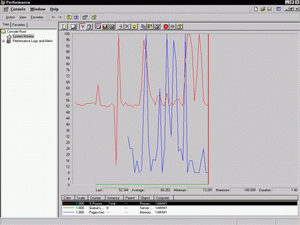
No secrets here: The chart view is the traditional real-time view of System Monitor that everyone thinks about first. It's good for observing several minutes of real-time data, much like an Electrocardiogram (ECG) machine used by doctors. In fact, the chart in Figure 1 appears to look a lot like an ECG in an intensive care ward-time to pull up the surgeon's gurneys!
|
| Figure 1.The traditional chart view of System Monitor. (Click on image to view larger version.) |
The explicit keystrokes for creating a chart are:
- Select Start, Programs, Administrative Tools, Performance to launch System Monitor.
- Right-click on the Details pane and select Add Counters from the secondary menu or click the "+" (plus) sign on the System Monitor toolbar. The Add Counters dialog box appears.
- Select the object:counters of your choice to monitor. Click Add to add an object:counter to the mix.
- Click Close to close the Add Counters dialog box when you've selected all of the object:counters you intend to monitor.
- Observe the System Monitor chart. If should look similar to Figure 1.
Note: You are working with object:counters in System Monitor. Objects are broad category areas and counters are specific measurements.
Histograms
A lesser-known view of System Monitor is the histogram view (see Figure 2). The histogram view, created by selecting the Histogram button on the toolbar, shows real-time information without regard for displaying any recent performance history. It's a good choice for presenting information more boldly, say, if you're using an overhead project unit in front of an audience. At the Windows 2000 launch in February 2000, a Microsoft employee used the histogram view to show the cluster load balancing capabilities of Windows 2000 Advanced Server. The vertical was bars pipe were moving up and down like pistons because of the immense amount of processing occurring during the presentation. Keep it in mind if you're a presenter.

|
Figure 2. Histogram view has appropriate uses to consider,
such as comparisons. (Click on image to view larger version.) |
The histogram view is good for presenting relative relationships. Figure 2 shows both processors on my Dell PowerEdge 1300 server running Microsoft Small Business Server 2000. At a glance, I can see the relative load that each processor is shouldering.
Alerts
Unfortunately, alerts aren't that sophisticated. They're fine for setting monitoring conditions, such as letting the Windows 2000 system know when processor utilization rates rise above 85 percent (see Figure 3), but the notification system is weak, with no email or paging capabilities. Basically alerts can make event log entries.
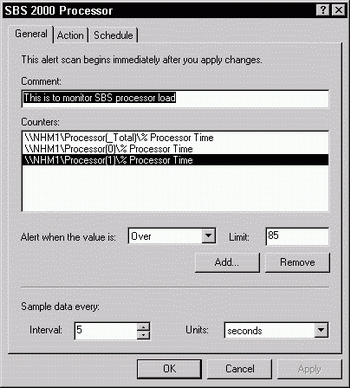 |
| Figure 3. Configuring an alert. |
However, expect vast improvements in alerts under the forthcoming BackOffice 2000 using Health Monitor 2.1 (I cover it in my review of BackOffice 2000 in the January 2001 issue of MCP Magazine).
To create an alert, expand the Performance Logs and Alerts objects in the console pane (left). Select the Alerts object in the console pane and right-click in the details pane. Select New Alert Settings from the secondary menu.
Logs
Logging is perhaps one of the least sexy yet most useful parts of System Monitor. Logging allows you to record data over long periods of time. Viewed over time, you can spot interesting trends and justify system upgrades, application enhancements and so on. This is the medical history of your system that increases in value as time passes and logs are periodically run again.
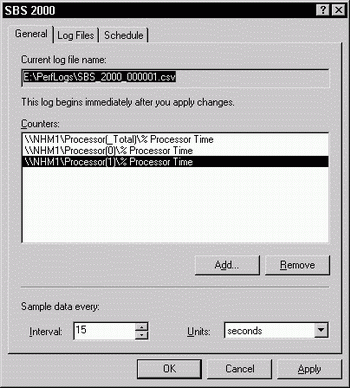 |
| Figure 4. Logging is configured directly in System Monitor. |
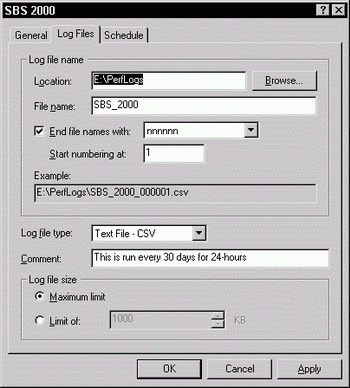 |
| Figure 5. The type of log file that System Monitor writes. |
To create a log, expand the Performance Logs and Alerts objects in the console pane (left). Select the Counter Logs object in the console pane and right-click in the details pane. Select New Log Settings from the secondary menu. I speak more about the MCSE consulting opportunity with System Monitor logging at the end of this column.
Reports
Last and least is reporting. Arrg. This view attempts to take histogram and charting information and present it in a table of columns and rows. It's lame and I won't show it to you. If you need reporting capabilities, there are numerous third-party offerings available elsewhere.
Six Steps to Start Using System Monitor
So, how does an MCSE consultant continue to make a buck in the long run after the Windows 2000 design/planning and implementation party is over? Just follow these six steps to financial freedom!
1. Create a Baseline
Basically, you set up System Monitor to log for a period of time, such as a 24-hour period in the middle of the week. The time interval that log entries are made can be 900-seconds (15-minutes). This initial baseline measurement, created via System Monitor logging, is truly the foundation measurements against what future logging efforts will be measured. Think of it as your starting medical or dental records that an MCSE pathologist will use to help determine cause of server death someday!
2. Log Baseline Objects
When you log with System Monitor, you log the objects. All of the counters for that object are logged automatically. When you analyze the baseline logs, you can specify individual counters inside an object to view. Consider logging the following objects to create your baseline (recognizing that you may add objects to this for specific applications, such as Microsoft Exchange and ISV applications):
- Cache
- Logical disk
- Memory
- Network Segment
- Network Interface
- Objects
- Physical Disk
- Process
- Processor
- Redirector
- Server Work Queues
- System
- Thread
3. Analyze the Baseline
Performance analysis is where the fun begins. I don't even have enough room in this column to get into the finer points of performance analysis other than to point you to wonderful references and offer the proper perspective.
Performance analysis is the subject of many chapters in several books available on Windows 2000. In my own book, Windows 2000 Server Secrets (IDG), I delve into this matter in Chapter 18. The Windows 2000 Professional Resource Kit has a section dedicated to performance analysis. The old Windows NT Server 4.0 in the Enterprise course set aside a couple of days to this topic. But if you want to save a buck for now, you can start with the wonderful Windows 2000 online Help system for more information on performance.
Now the perspective. Performance analysis is only valuable over time. The logged information you create for your baseline is a snapshot. The value is in the accumulation of several months worth of logs, where you can observe how your system has changed since its baseline measurement period. This type of thinking continues with the next steps.
4. Add to the Baseline
Periodically, you need to run the same logging again, capturing at least the same objects. I've seen MCSEs pitch this to their clients as monthly or quarterly services. It's a service that my clients have gladly paid for in the past and I suspect will continue to do so.
5. Long-Term Trend Analysis
You've followed the steps and have a library of System Monitor logs. Now, when you chart specific object:counters from different logs (note that System Monitor allows you to stack charts for side-by-side analysis), long-term trends start to emerge. Here, the idea is to graphically observe changes in performance-often for the worst-as new applications are introduced, users added, and so on. 6. Create a New Baseline
As in all research, it's essential that you compare apples to apples. Thus, if you purchase a new server machine and retire the old machine, you need to create a new System Monitor baseline log. You'll then capture additional logs from that date forward for a new round of performance analysis. If you upgrade a server and copy a log from the older server, it's likely you'd see marked performance improvements, something that might indeed be misleading.
Again, the strategy presented above applies equally well to in-house MCSE LAN administrators and system engineers with a slight twist. These people are typically overloaded with work and are compensated on salary. The in-house admin, while appreciative of the power of System Monitors, often doesn't have the time or energy to fully exploit this tool. System Monitor Secrets
So now a few "been there, done that" Windows 2000 System Monitor-related secrets:
- System Monitor now runs as a service, not an application. This allows you to log off of the Windows 2000 machine running System Monitor without disrupting the logging process.
- Many BackOffice and ISV applications provide pre-configured System Monitor templates. These are typically found on the CD-ROM Disc that accompanies the software and represents the critical object:counters the developers feel you should monitor. If you're monitoring a Windows 2000 Serve, run System Monitor from a Windows 2000 Professional machine. If you run System Monitor on the server, it's likely you may create some false reads.
- An often overlooked way to view the data you log in System Monitor is to use a Web browser. This is simple to do: In the logging view, right-click the log file listed in the details pane of System Monitor and select Save As. Save the log file as an HTML file so that you can open it in a browser. The resulting view (see Figure 6) isn't just a pretty picture; it's actually a Web-enabled copy of System Monitor, allowing you to add counters and so on.
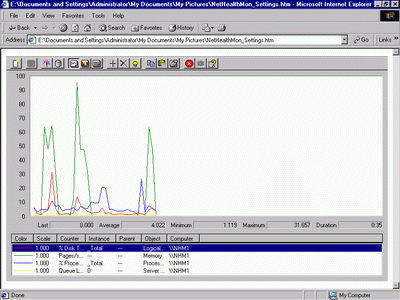 |
| Figure 6. Nifty trick; view System Monitor counters through your browser. |
Until the day comes when Microsoft builds a version of Windows 2000 that runs and repairs itself, you still have work to do. System Monitor allows you to take preventative care of the server and report on its results to your clients or boss.
Next time, I'll show you how to use Network Monitor to troubleshoot nagging network problems. 
This article orginally appeared on MCPmag.com, November 2000. Reprinted with permission.
|

