|
From CertCities.com
|
||||||||||||
|
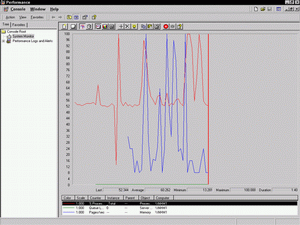
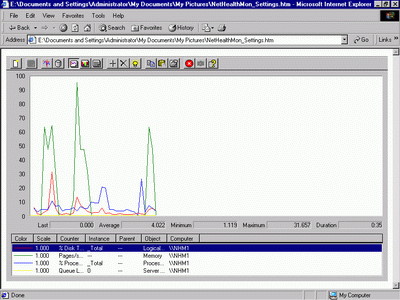
Column Windows 2000 Foundations Checking Your Server's Heartbeat Harry shares tips for keeping your network healthy using System Monitor and gives away a few secrets, as well. by Harry Brelsford - courtesy of Microsoft Certified Professional Magazine 11/15/2000 -- Speaking from an MCSE consultant's perspective, a paradox of being a Windows 2000 consultant is how to make a great living after the install is completed? Many MCSE consultants discover with Windows 2000 that their billable hours are behind them after the design, planning and implementation of the network. In fact, a frustration that causes some consultants to leave the business altogether is the project-by-project workflow of Windows 2000 consulting, with consultants going from one implementation to another. It's no way to make a steady living. Enter System Monitor to the rescue. If you're an MCSE consultant, you can use System Monitor to provide services to clients long after implementation, which can add real value to the consulting relationship. (Although I focus on independent consultants in this column, in-house IT professionals should find the tips below to be of value.) Defining System MonitorPerhaps the first thing you noticed about System Monitor is that it's free. System Monitor is installed as part of the Windows 2000 Server or Windows 2000 Professional basic setup. It certainly wasn't lost on me that, compared to my NetWare days when I used PERFORMANCE.NLM, the System Monitor in Windows 2000 is much more powerful. And it wasn't lost on me that I didn't have to spend several hundred dollars purchasing a third-party performance monitoring application. System Monitor has five distinct interfaces that it presents to you: charts, histograms, alerts, logs and reports. Each of these faces is accessible from a toolbar button in System Monitor. You typically right-click in the details pane (the big space to the left) and select New to configure one of the five faces. These keystrokes are consistent with the way you configure other Microsoft Management Console (MMC) snap-ins, so I'll only show you the keystrokes for creating a chart. (I'll present the four steps for using System Monitor as an MCSE consultant later in this article.) ChartsNo secrets here: The chart view is the traditional real-time view of System Monitor that everyone thinks about first. It's good for observing several minutes of real-time data, much like an Electrocardiogram (ECG) machine used by doctors. In fact, the chart in Figure 1 appears to look a lot like an ECG in an intensive care ward-time to pull up the surgeon's gurneys!
The explicit keystrokes for creating a chart are:
Note: You are working with object:counters in System Monitor. Objects are broad category areas and counters are specific measurements. Histograms
The histogram view is good for presenting relative relationships. Figure 2 shows both processors on my Dell PowerEdge 1300 server running Microsoft Small Business Server 2000. At a glance, I can see the relative load that each processor is shouldering. Alerts
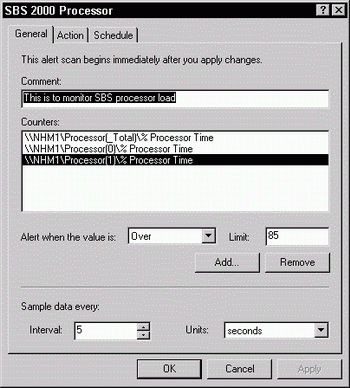
However, expect vast improvements in alerts under the forthcoming BackOffice 2000 using Health Monitor 2.1 (I cover it in my review of BackOffice 2000 in the January 2001 issue of MCP Magazine). To create an alert, expand the Performance Logs and Alerts objects in the console pane (left). Select the Alerts object in the console pane and right-click in the details pane. Select New Alert Settings from the secondary menu. Logs
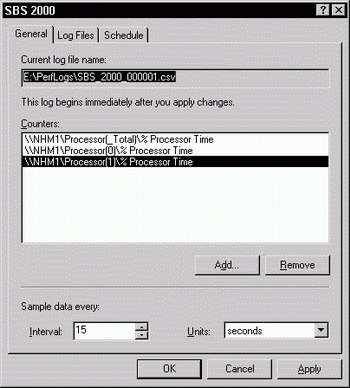
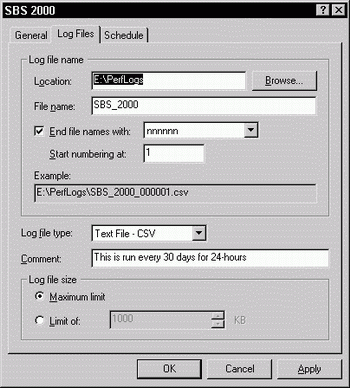
To create a log, expand the Performance Logs and Alerts objects in the console pane (left). Select the Counter Logs object in the console pane and right-click in the details pane. Select New Log Settings from the secondary menu. I speak more about the MCSE consulting opportunity with System Monitor logging at the end of this column. Reports Six Steps to Start Using System Monitor 1. Create a Baseline 2. Log Baseline Objects
Performance analysis is where the fun begins. I don't even have enough room in this column to get into the finer points of performance analysis other than to point you to wonderful references and offer the proper perspective. Performance analysis is the subject of many chapters in several books available on Windows 2000. In my own book, Windows 2000 Server Secrets (IDG), I delve into this matter in Chapter 18. The Windows 2000 Professional Resource Kit has a section dedicated to performance analysis. The old Windows NT Server 4.0 in the Enterprise course set aside a couple of days to this topic. But if you want to save a buck for now, you can start with the wonderful Windows 2000 online Help system for more information on performance. Now the perspective. Performance analysis is only valuable over time. The logged information you create for your baseline is a snapshot. The value is in the accumulation of several months worth of logs, where you can observe how your system has changed since its baseline measurement period. This type of thinking continues with the next steps. 4. Add to the Baseline 5. Long-Term Trend Analysis As in all research, it's essential that you compare apples to apples. Thus, if you purchase a new server machine and retire the old machine, you need to create a new System Monitor baseline log. You'll then capture additional logs from that date forward for a new round of performance analysis. If you upgrade a server and copy a log from the older server, it's likely you'd see marked performance improvements, something that might indeed be misleading. Again, the strategy presented above applies equally well to in-house MCSE LAN administrators and system engineers with a slight twist. These people are typically overloaded with work and are compensated on salary. The in-house admin, while appreciative of the power of System Monitors, often doesn't have the time or energy to fully exploit this tool. System Monitor SecretsSo now a few "been there, done that" Windows 2000 System Monitor-related secrets:
Until the day comes when Microsoft builds a version of Windows 2000 that runs and repairs itself, you still have work to do. System Monitor allows you to take preventative care of the server and report on its results to your clients or boss. Next time, I'll show you how to use Network Monitor to troubleshoot nagging network problems. This article orginally appeared on MCPmag.com, November 2000. Reprinted with permission. Bainbridge Island, Washington author Harry Brelsford, MCSE, MCT, is the founder and CEO of NetHealthMon.com, a Seattle-based firm providing fee-based remote network monitoring for BackOffice 2000 and Small Business Server 2000. The author of eight technology books including MCSE Consulting Bible (IDG), Teach Yourself Small Business Server 2000 in 21-Days (Macmillan) and Windows 2000 Server Secrets (IDG), Harry is a long-time faculty member at Seattle Pacific University (www.spu.edu/microsoft) where he teaches MCSE certification courses online. Reach him at . |
||||||||||||
|
top Copyright 2000-2005, 101communications LLC. See our Privacy Policy. For more information, e-mail . |
